
It is week eleven. The admin dashboard says 78% of your team activated the AI tool you bought in January. Weekly active users: nine out of forty-two. Nobody complained. Nobody filed a support ticket. They just stopped opening it.
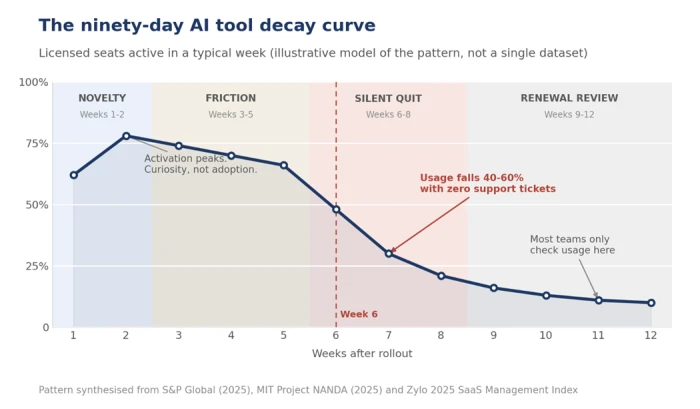
Teams abandon AI tools within three months because the payoff arrives after the novelty runs out. Excitement carries usage for roughly two weeks. Friction shows up around week three. By week six the tool has quietly lost most of its users, and by month three someone in finance is asking whether to renew.
This is the most expensive pattern in enterprise software right now, and it is well documented. What follows traces those ninety days from purchase to abandonment, using data from the US Census Bureau, S&P Global Market Intelligence, MIT, RAND, the London School of Economics and Zylo. The later sections cover the warning signals that appear weeks before a tool dies, plus the interventions that keep it alive.

The numbers behind the quiet quit
Something changed between 2024 and 2025. Companies stopped starting AI projects and started killing them.
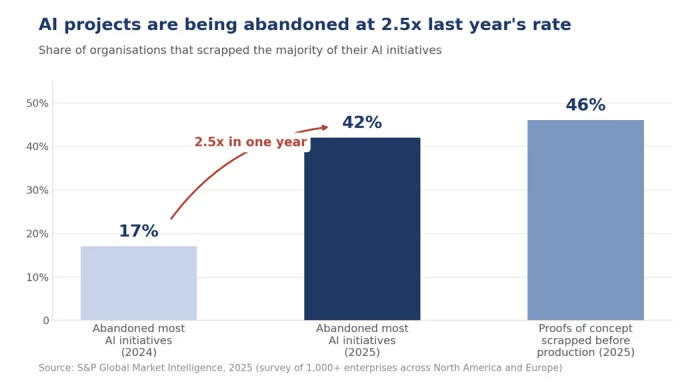
S&P Global Market Intelligence surveyed more than 1,000 businesses across North America and Europe. The share of companies that scrapped the majority of their AI initiatives rose from 17% in 2024 to 42% in 2025. The average organisation abandoned 46% of its AI proofs of concept before they ever reached production. Fortune covered the same dataset under a blunter framing, reporting that AI fatigue was setting in among leaders facing repeated failures.
Gartner had called it early. In July 2024 the firm predicted that at least 30% of generative AI projects would be abandoned after proof of concept by the end of 2025, naming poor data quality and unclear business value among the causes. The measured figure came in above the forecast.
RAND Corporation puts the broader failure rate above 80%, roughly twice the failure rate of IT projects with no AI component. That estimate came out of interviews with 65 experienced data scientists and engineers, so it reads best as "the large majority fail" rather than a precise measurement.
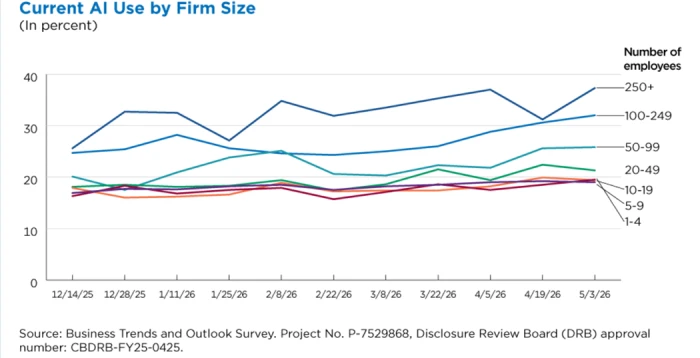
Then the adoption curve itself bent. The US Census Bureau runs its Business Trends and Outlook Survey across 1.2 million firms every two weeks. Firms with 250 or more employees peaked at roughly 13.4% AI use in July 2025, then slid to 11.7% by September. It was the first sustained decline since the Bureau began asking the question in late 2023.
The rebound matters as much as the dip. Census broadened its AI question in November 2025 to cover use in any business function, and the numbers climbed again: overall usage sat between 17% and 20% from December 2025 to May 2026, with firms of 250 or more employees at 37%. Adoption recovered. What did not recover was the assumption that buying a tool produces a user.
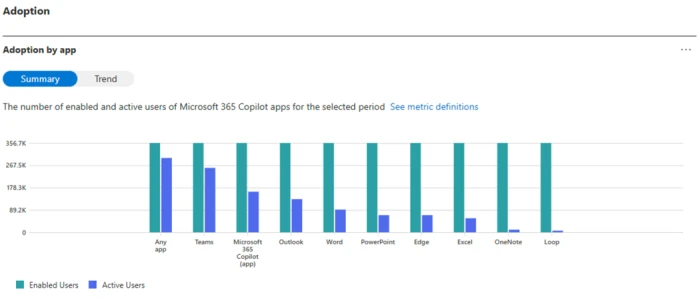
Two numbers explain the gap between purchase and use. Zylo's 2025 SaaS Management Index found that only 49% of provisioned software licences are actually used, and that the average organisation now burns $21 million a year on seats nobody opens, up 14.2% year over year.
Those figures cover all software. AI tools sit at the worst end of the range because they are bought fastest and governed last.
The ninety-day decay curve
The statistics above describe outcomes. They do not describe the sequence. Usage does not fall off a cliff on day 90. It erodes on a schedule, and each phase has a different cause and a different fix.
| Phase | Weeks | What the dashboard shows | What is actually happening |
|---|---|---|---|
| Novelty | 1 to 2 | Activation of 70% to 90% | Curiosity-driven logins, no load-bearing work |
| Friction | 3 to 5 | Usage flat, tickets near zero | First hard task handled badly, trust dips |
| Silent quit | 6 to 8 | Weekly active down 40% to 60% | Users revert to old process without telling anyone |
| Renewal review | 9 to 12 | Single-digit weekly active users | Finance flags the line item, champion goes quiet |
Weeks one and two: the novelty spike
Everyone logs in. They ask it to summarise a meeting or draft an email they were going to write anyway. Activation looks spectacular because activation measures curiosity.
The login is the number that lies. A login is not adoption. Adoption is the moment somebody picks the tool over the way they already did the task.
Weeks three to five: friction discovery
The first load-bearing assignment lands. Someone asks the tool to pull correct figures out of a messy spreadsheet, or to draft a client update that references last quarter's numbers. The output comes back plausible and slightly wrong.
Now the user has a second job: checking the work. If verification takes eight minutes on a task the tool saved ten minutes on, the net gain is two minutes and a new kind of stress. Section four returns to this cost, because it is the single most underrated driver of abandonment.
Weeks six to eight: the silent quit
Nothing dramatic happens in week six, which is exactly what makes it dangerous.
People revert. They stop opening the tab. They do not raise it in standup, partly because abandoning a tool feels like a personal failure rather than a product problem, and partly because nobody asked. Usage decays without a single support ticket to signal it. Every organisation that discovers abandonment at renewal discovers it eight weeks late.
Weeks nine to twelve: the renewal question
Finance runs the quarterly software review and pulls the seat report. The champion who pushed for the purchase either defends it with anecdotes or stays quiet. Anecdotes lose to a utilisation number every time.
Each phase in that table has its own failure driver. The next section names them.
Seven reasons teams walk away
1. The tool sits outside the workflow
Surviving AI tools are the ones embedded where people already work. If using it means opening a new tab, re-uploading a file, then copying the output back into the real document, that friction compounds across every single use. The old process wins because it costs zero cognitive switching.
MIT framed the same problem as a learning gap. Generic assistants suit individuals because they are flexible, and they stall inside organisations because they do not retain context or adapt to a specific workflow. The tool that cannot remember how your team formats a client report will be asked to format one exactly twice.
2. It solved a leadership problem, not a work problem
MIT's Project NANDA found that more than half of generative AI budgets went to sales and marketing, while the measurable returns clustered in back-office automation. Tools bought to demonstrate an AI strategy get deployed to the most visible department rather than the one with the worst friction.
The tell is procedural. Nobody spent thirty minutes sitting beside the person who would use the tool daily, watching what they actually do, before the purchase order went out.
3. Nobody owned adoption after launch
Procurement always has an owner. Rollout usually does not. RAND's root-cause analysis repeatedly surfaces fading executive sponsorship: leadership backs the launch, attention shifts to the next initiative, and the team left holding the tool has no authority to change the surrounding process.
4. The verification tax exceeds the time saved
The LSE and Protiviti research found that fewer than half of AI users (49%) trust AI-driven decisions. Distrust is a rational response to output that is confidently wrong, and it converts directly into time. Every draft that needs a full read-through before it can be sent erases the saving that justified the purchase.
Tools that survive this phase tend to be the ones where a wrong answer is cheap to spot.
5. Training was one lunch session
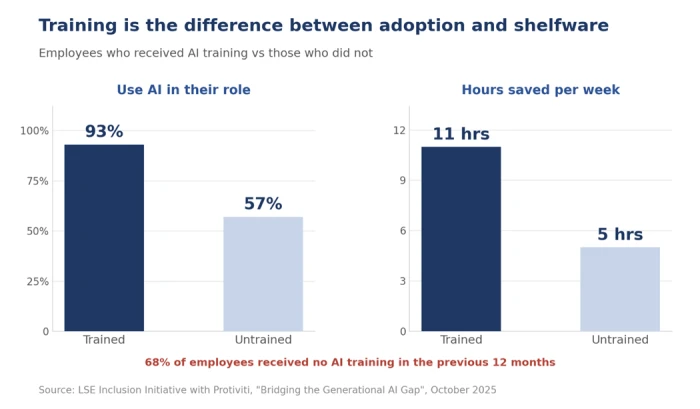
This is the highest-leverage number in the entire dataset. The London School of Economics Inclusion Initiative, working with Protiviti, surveyed nearly 3,000 workers and 240 executives. Employees who received AI training used AI in their roles at a rate of 93%, against 57% for those who did not. Trained employees saved an average of 11 hours a week compared with 5 hours for the untrained.
The same study found that 68% of employees had received no AI training in the previous twelve months. Training was the decisive factor, ahead of age or seniority.
6. Shadow AI already won
Project NANDA surfaced a gap that explains a lot of dead dashboards. Around 40% of companies had bought official large language model subscriptions, while roughly 90% of surveyed employees reported using personal AI tools for work.
Your team is not resisting AI. They are using a consumer chatbot on a second screen because it has no approval workflow, no onboarding, no admin console and no learning curve. The sanctioned tool is competing against a habit that is already established.
7. Sprawl turned it into shelfware
Zylo found that lines of business now control 70% of SaaS spend, while IT manages 26.1%. Four teams buy four overlapping AI tools and nobody reconciles them. Zylo also reported that 66.5% of IT leaders hit unexpected charges from consumption-based or AI pricing models, which turns a quiet tool into an expensive quiet tool.
Shelfware is the end state of that pattern: software that is paid for, provisioned, and never opened.
What the 95% statistic actually measured
Every article on this subject opens with the same number. Check it before you build a decision on it.
MIT's Project NANDA published "The GenAI Divide: State of AI in Business 2025". Coverage compressed it into one line: 95% of generative AI pilots fail. The evidence base was 52 structured interviews, a survey of roughly 150 senior leaders, a survey of 350 employees, and analysis of more than 300 publicly disclosed AI deployments.
Read the finding precisely. It reported that 95% of those pilots produced no measurable profit-and-loss impact. That is a narrower claim than failure. A pilot where twelve people each saved four hours a week, with no baseline recorded before deployment, sits inside the 95%.
The methodology drew real criticism. Futuriom argued that the 95% figure appears in the report without supporting data behind it and that the sample demographics were never disclosed. Wharton professor Kevin Werbach was among those questioning how the conclusion followed from the evidence presented.
The direction holds, because the independent surveys quoted earlier converge on it. What changes is the lesson you take. If the dominant failure mode is unmeasured value rather than absent value, then some tools get cancelled while they are working, and the tools that survive are often the ones whose champions simply kept better records.
Which makes the practical question narrower than "is AI worth it". The question is whether you can tell, before the renewal date, which of your tools is dying.
What the surviving 5% did differently
The same MIT dataset that produced the headline also recorded what separated the successes, and the pattern has nothing to do with model choice.
Buying beat building. Tools purchased from specialised vendors, with a real partnership behind them, succeeded around 67% of the time. Internally built systems succeeded roughly a third as often. That gap was widest in regulated sectors such as financial services, where the instinct to build in-house is strongest.
Ownership sat close to the work. Adoption driven by line managers outperformed adoption driven by a central AI function, because managers pick tools that fit the process they supervise every day and drop the ones that do not.
Scope stayed narrow. The successful deployments picked one pain point and executed it properly rather than rolling a general assistant across the company and hoping something stuck.
The report also traced the funnel that produces the abandonment described in section two: 60% of organisations evaluated enterprise-grade AI systems, 20% reached a pilot, and 5% reached production. Most of the loss happened between pilot and production, which is precisely the window the decay curve covers.
Five signals that a tool is about to die
These are diagnostics to run on your own admin console, not research findings. Treat the thresholds as starting points and calibrate them against your own baseline after one full quarter.
| Signal | Threshold worth investigating | Where to check it |
|---|---|---|
| Activation high, weekly use low | Weekly active users below 40% of licensed seats by day 30 | Vendor admin console or seat report |
| Usage concentrated in a few people | Top three users generate more than 60% of total sessions | Per-user activity export |
| Zero use in the target workflow | The job you bought it for is still done the old way | Ask the team lead directly, not the dashboard |
| Sessions collapsing in length | Average session under two minutes | Session duration report |
| No documented win by day 45 | No named person, task and hours saved on record | Your own rollout notes |
The ninety-day retention playbook
Each block below maps to a phase from the decay curve. The interventions are deliberately unglamorous, because the failure is operational rather than technical.
Days 0 to 30: engineer one win
• Record a baseline before rollout. How long does the target task take today, and who does it? Without this number you cannot prove value later, which is the exact trap the MIT finding describes.
• Pick one workflow. Not a department, not a use-case list. One repeated task with a measurable cost.
• Name an adoption owner with a job title, and give them time on their calendar for it.
• Get one documented win on record inside four weeks: a named person, a named task, hours saved.
Days 31 to 60: remove the friction, not the tool
• Sit with two users for thirty minutes each and watch them work. The friction is almost never where the vendor demo suggested it would be.
• Close the integration gap. If people copy output between two systems by hand, fix that before you blame usage.
• Run structured training, not a lunch session. The 93% against 57% usage gap from the LSE data is the cheapest lever available to you.
• Publish the week-four win internally so the tool has a story attached to it.
Days 61 to 90: prove it or cut it
• Compare current task time against the day-zero baseline.
• Pull the seat report and reclaim inactive licences before renewal rather than after.
• Hold a decision meeting that was booked on day one. A scheduled decision beats a drifting subscription.
Renew, replace or kill
At day 90 the evidence usually points cleanly in one direction. The table below turns the signals from section five into a decision.
| What the evidence shows | Decision | Next action |
|---|---|---|
| Documented win, usage spread across the team, task time down against baseline | Renew | Expand to a second workflow, keep the same owner |
| Usage concentrated in two or three power users who genuinely rely on it | Downsize | Cut seats to the active users and renegotiate the tier |
| Users engaged early, then hit an integration wall you can identify | Replace | Shortlist tools that sit inside the existing workflow |
| No win recorded, no active users, nobody defends it | Kill | Cancel before auto-renewal and document why, so the next purchase avoids it |
One correction to make before anything else: move the review from day 90 to day 45. The decay curve puts the silent quit at weeks six to eight, which means a quarterly cadence guarantees you find out after the tool is already dead. A single seat report at week six, read by someone who owns the outcome, is the cheapest diagnostic in your entire software stack.



Comments 0
Join the discussion and share your perspective.
Sign in to post a comment and reply to other readers.
No comments yet
Be the first to share your perspective on this article.